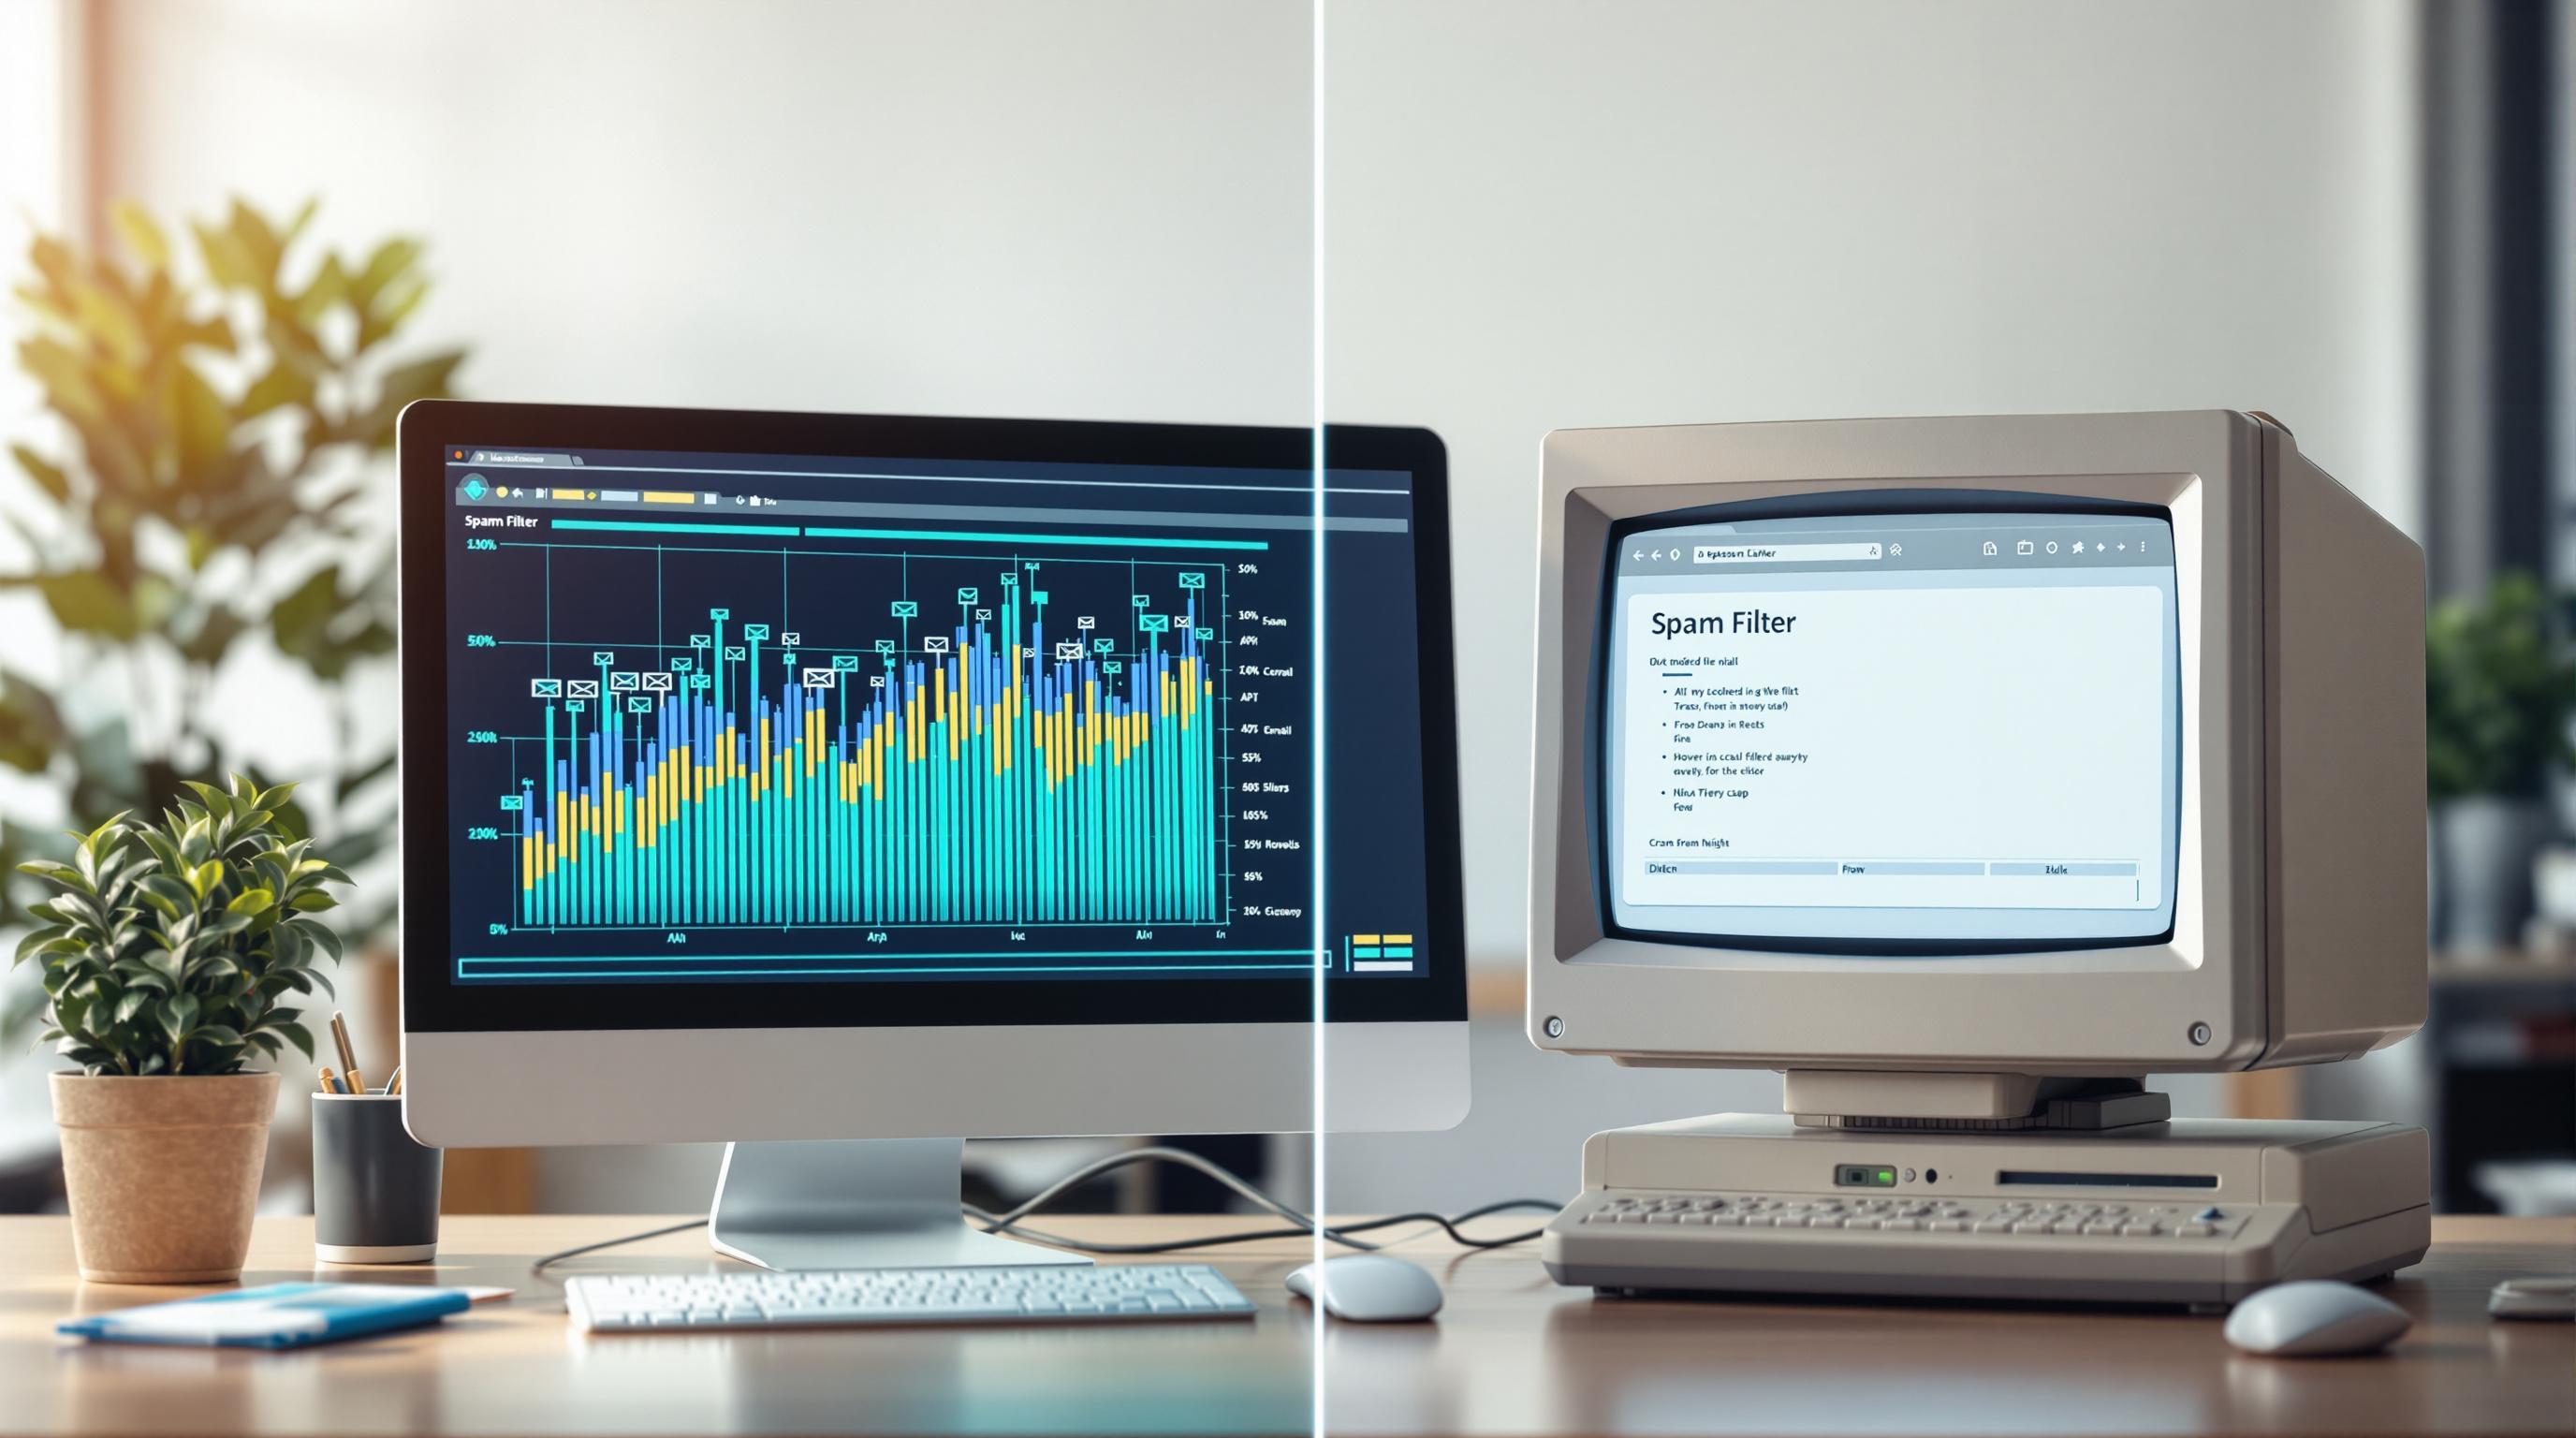
Interactive dashboards simplify user behavior analysis by turning complex data into easy-to-understand visuals, updated in real-time. They allow teams to track user actions, segment audiences, and integrate feedback - all without needing technical expertise.
Key Highlights:
- Real-time updates: Always have the latest user insights.
- Customizable layouts: Organize data to match your needs.
- Data integration: Connect tools like CRMs, analytics platforms, and logs.
- Behavior analysis methods: Track user journeys, group behaviors, and feedback.
- Setup tips: Choose relevant metrics, implement tracking, and create role-specific views.
Dashboards save time by automating data cleaning, visualization, and analysis, helping teams focus on decision-making. Learn how to set them up and manage them effectively to drive business growth.
Designing Effective Interactive Dashboards
Key Dashboard Components
Interactive dashboards combine live updates, flexible layouts, and data integrations to provide clear insights into user behavior.
Live Data Updates
Dashboards with real-time updates offer immediate insights into user actions. As users navigate or interact with features, the dashboard refreshes automatically, ensuring teams always have the latest information to act quickly.
Customizable Layout Options
Flexible layouts let teams arrange visuals and metrics to suit their analysis needs. This means related data can be grouped together, and key insights can be prominently displayed for easy interpretation.
Data Source Connections
By linking tools like CRM systems, web analytics platforms, and in-app logs, dashboards bring together both current and historical user behavior, offering a complete view in one place.
Next, let’s look at how these elements can be used to analyze user behavior effectively.
User Behavior Analysis Methods
To understand user behavior effectively, leverage live updates, adaptable layouts, and integrations. Focus on three key methods: journey tracking, group analysis, and feedback integration. These approaches help uncover user paths, behavior segments, and sentiment for precise insights.
User Journey Tracking
Track user actions to identify successful paths and obstacles.
Key areas to monitor:
- Entry points: Understand how users arrive - through organic search, direct traffic, or marketing campaigns.
- Navigation patterns: Observe how users move across pages and interact with features.
- Exit points: Pinpoint where users complete goals or abandon their journey.
- Time metrics: Measure time spent on each step and overall session duration.
User Group Analysis
Divide users into meaningful segments based on behavior, engagement, lifecycle stage, and feature usage.
Interactive dashboards can group users by:
- Behavioral trends: Categorize users by how they typically interact with your platform and their feature preferences.
- Engagement levels: Distinguish between highly active users and occasional visitors.
- Customer lifecycle: Track users from new sign-ups to loyal, long-term customers.
- Feature adoption: Identify which groups are quickest to embrace new features.
Keep these segments updated dynamically to reflect changing user behaviors.
User Feedback Analysis
Combine usage data with direct feedback to gain a well-rounded view of user behavior.
Modern dashboards can incorporate:
- Survey results: Display real-time user feedback alongside usage statistics.
- Support tickets: Analyze common issues and their connection to specific features.
- Feature requests: Organize and track user suggestions for platform improvements.
- Satisfaction metrics: Monitor NPS or CSAT scores over time to gauge sentiment.
By linking feedback - like survey responses and satisfaction scores - with usage patterns, you can identify areas for improvement and measure the impact of changes.
Next, follow a step-by-step process to set up these analysis dashboards.
sbb-itb-bec6a7e
Setting Up Behavior Analysis Dashboards
Choose Your Metrics
Start by aligning your KPIs with earlier analysis methods like user journeys, segments, and feedback. This ensures a complete understanding of user behavior. Choose metrics that match your business goals.
Key metrics to track include:
- Engagement: session duration, pages per visit, interaction rate
- Conversion: sign-up rate, feature adoption, purchase completion
- Retention: return visitor rate, churn rate, feature stickiness
- Technical: page load time, error rates, API response times
Once you've identified your KPIs, set up tracking to collect data.
Set Up User Tracking
To monitor user behavior effectively, implement tracking methods such as:
- Event tracking: Define and track specific actions (e.g., clicks, form submissions, feature usage).
- User identification: Assign unique user IDs to follow behavior across multiple sessions.
- Custom attributes: Add relevant tags like plan type, industry, or company size for better segmentation.
- Error logging: Keep an eye on technical issues that could disrupt the user experience.
Build Custom Views
Tailor dashboards to meet the needs of different stakeholders using tools that offer advanced visualization features.
Organize dashboards with these roles in mind:
- Executive Overview: Focus on high-level KPIs and trends.
- Product Team View: Highlight feature adoption, user flow analysis, drop-off points, and error patterns.
- Marketing Team View: Include traffic sources, conversion funnels, campaign performance, and user segmentation.
Incorporate dynamic visuals and set up alerts to notify teams of critical changes.
AI-powered tools can enhance data visualization, making it easier to create interactive charts and reports tailored to your needs.
Dashboard Management Tips
After launching your dashboards, focus on maintaining accuracy and scalability.
Automating Updates
Set up your dashboard’s built-in tools to refresh data and trigger workflows automatically. This keeps your custom views aligned with real-time activities without constant manual intervention.
Ensuring Data Security
When dealing with sensitive user data, enforce strict access controls and anonymization practices. Use automated anonymization features and role-based permissions to limit access. Keep a detailed log of dashboard access, data exports, and configuration changes for auditing purposes.
Planning for Growth
Prepare your dashboards for increased usage by automating tasks like data cleaning, analysis, and visualization. This helps your system handle larger user volumes efficiently.
Conclusion
Interactive dashboards turn user data into practical insights with real-time updates, flexible layouts, and detailed tracking. Adding AI-driven analytics takes this even further with automated analysis, predictive models, and tailored user experiences.
By combining journey tracking, group segmentation, and feedback integration, businesses can gain a complete picture of user behavior and preferences.
Check out AI for Businesses for tools that automate processes, improve visualizations, and help you better understand user trends. Use the setup, analysis, and management tips in this guide to make the most of your dashboard and drive business growth.


